R package · D3.js · SVG

Interactive D3 charts, one R function at a time
ddplot turns a data frame into an interactive SVG chart. More than 40 chart types, from everyday line and bar charts to chord diagrams and sunbursts, that work in the RStudio viewer, R Markdown, Quarto and Shiny. No JavaScript required.
install.packages("ddplot")
One function per chart
Pass a data frame and column names. Every chart shares the same vocabulary: title, xtitle, fill, bgcol, font…
Interactive by default
Tooltips, hover highlights, sorting and animations. line_chart() adds zoom, range buttons, a navigator and annotations.
Works where R works
RStudio viewer, R Markdown, Quarto, and Shiny through d3Output() and renderD3(). Save any chart as a standalone HTML file.
Start with the essentials
The charts most projects need. Each card opens the chart's guide with live examples.
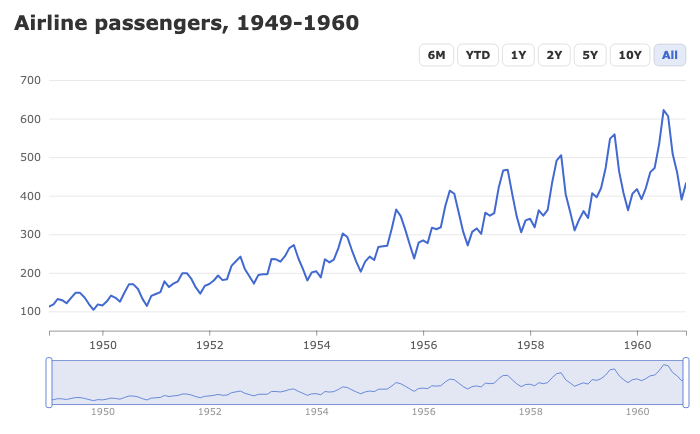
Line chart
One or many series, with zoom, a navigator, annotations and forecast ribbons.
line_chart()
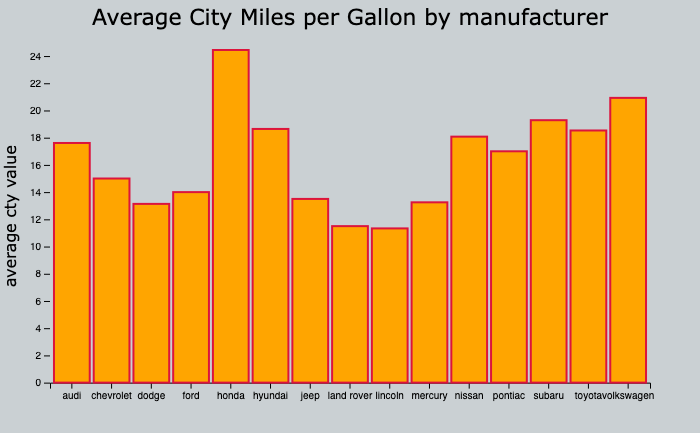
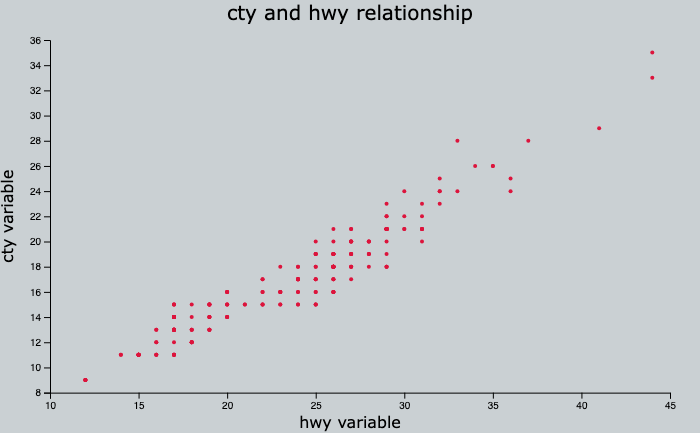
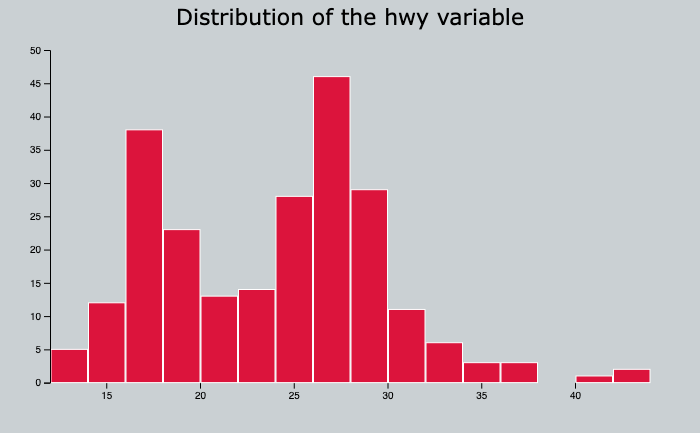
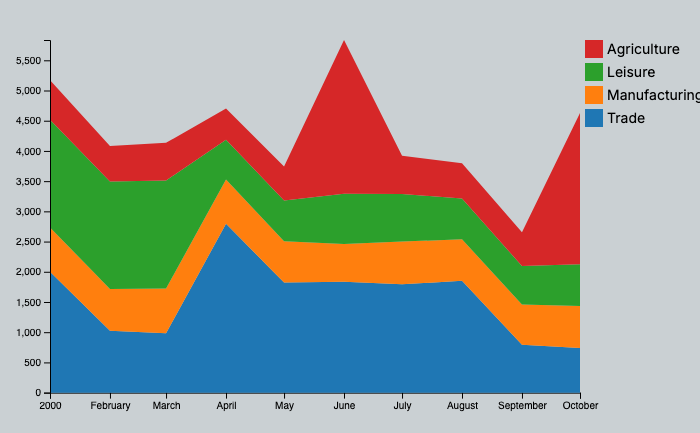
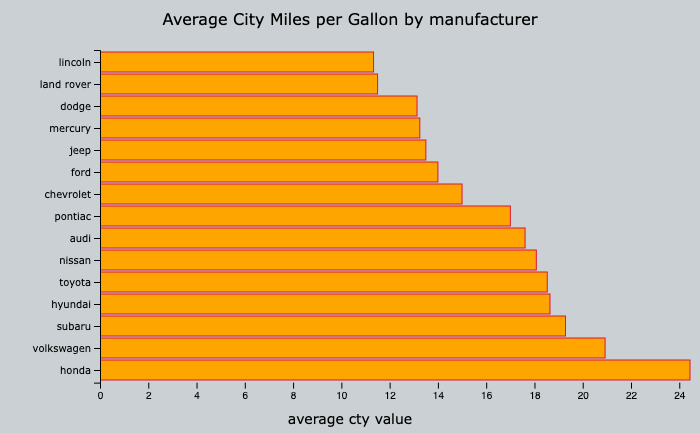
Browse by family
Families are ordered from the charts you are most likely to need to the more specialised ones.
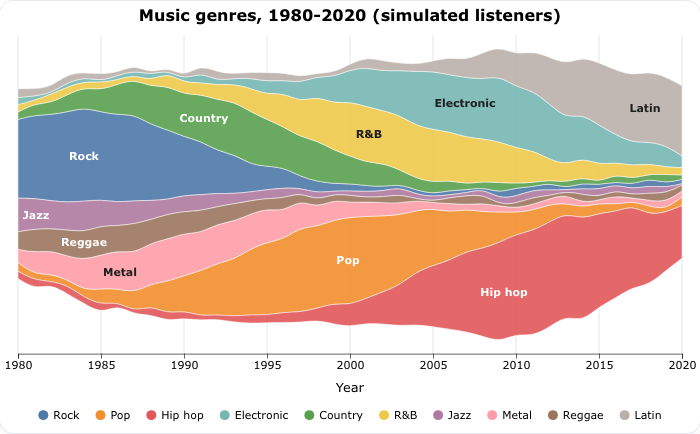
Time series and trends 7
line, area, stacked area, band, streamgraph, calendar
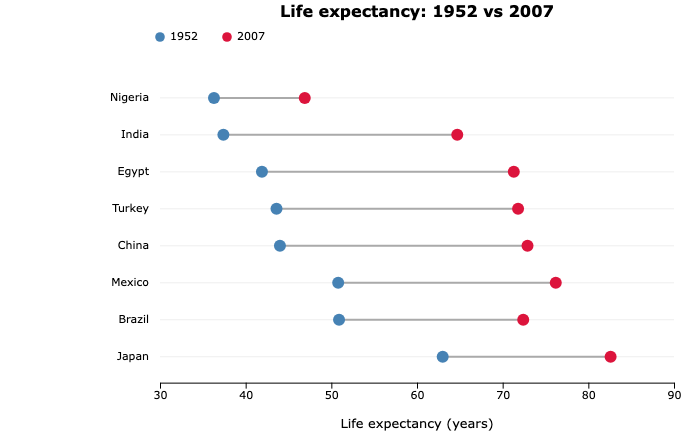
Comparing categories 11
bars, lollipops, dumbbell, slope, bump, waterfall, radar
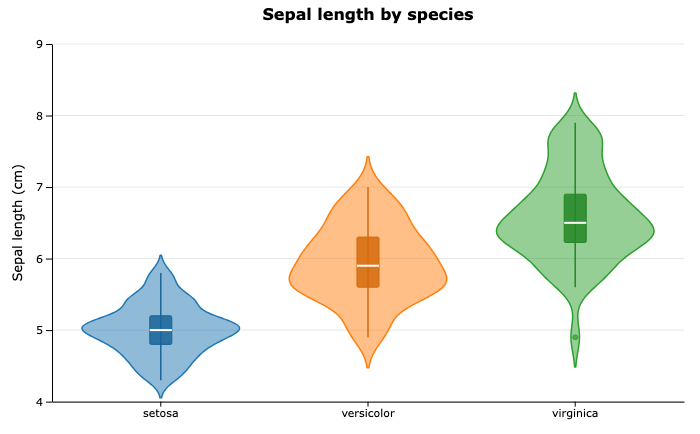
Distributions 5
histogram, violin, beeswarm, ridgeline
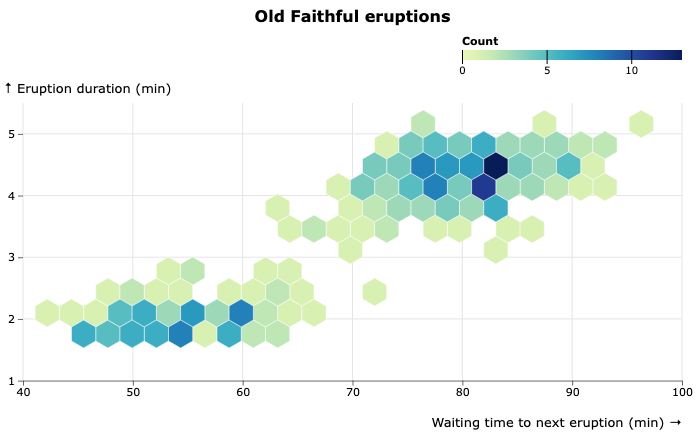
Relationships and flows 3
scatter, hexbin, chord diagram
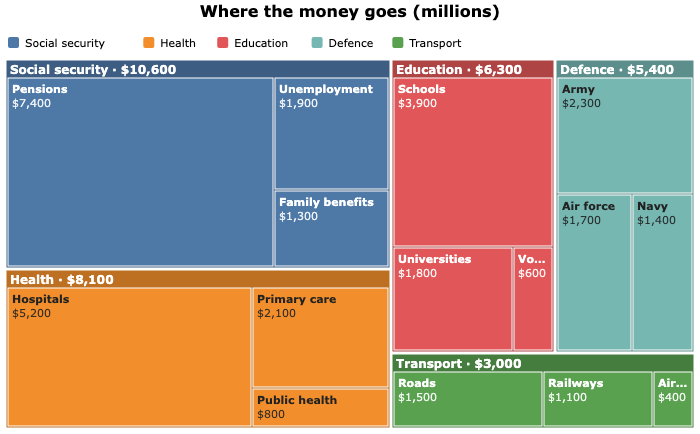
Part-to-whole and hierarchies 7
pie, treemap, waffle, sunburst, mosaic, rose, parliament
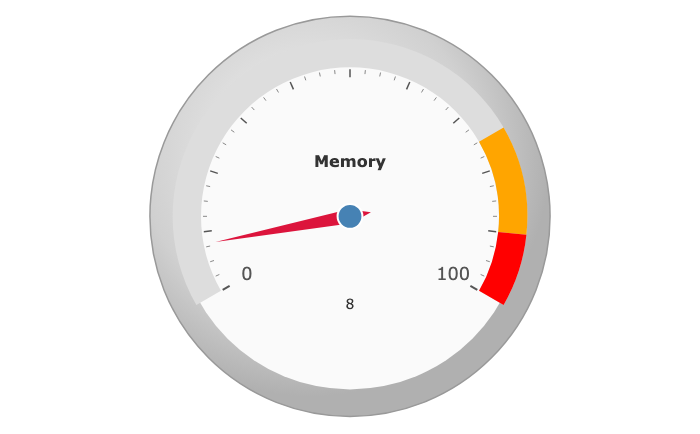
KPIs and monitoring 4
gauge, bullet, liquid fill, pulse grid

Playful indicators 5
heart, glass, plant, flame, flower
A first chart
A ts object, or a data frame with a date column and one or several value columns, is all line_chart() needs:
library(ddplot)

line_chart(
  EuStockMarkets,
  transform = "index",
  title = "European stock indices",
  subtitle = "Rebased to 100 at the first visible date"
)
Hover to read every series at a date, drag on the chart to zoom, click the legend to hide a series. The Get started guide goes further, and covers Shiny.
Installation
Install the released version from CRAN:
install.packages("ddplot")Or the development version from GitHub:
remotes::install_github("feddelegrand7/ddplot")Code of Conduct
Please note that the ddplot project is released with a Contributor Code of Conduct. By contributing to this project, you agree to abide by its terms.