
Every chart in ddplot, grouped by what it is for and
ordered by how often you are likely to need it. Click a card to see the
chart’s guide with live examples, or open its reference page for the
full list of arguments.
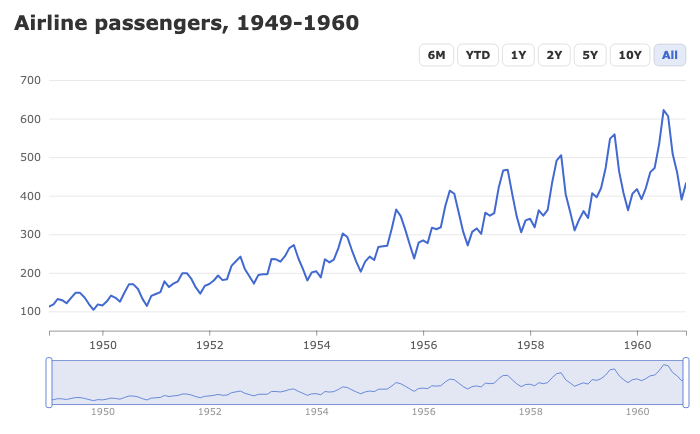
Line chart
You track one or many series over time and want to zoom, compare and annotate.
line_chart()
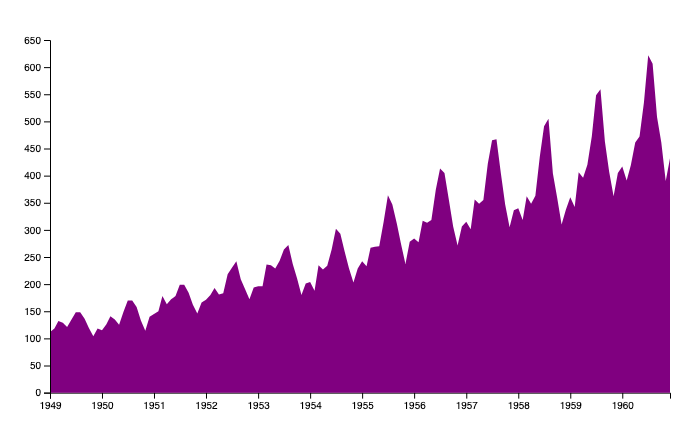
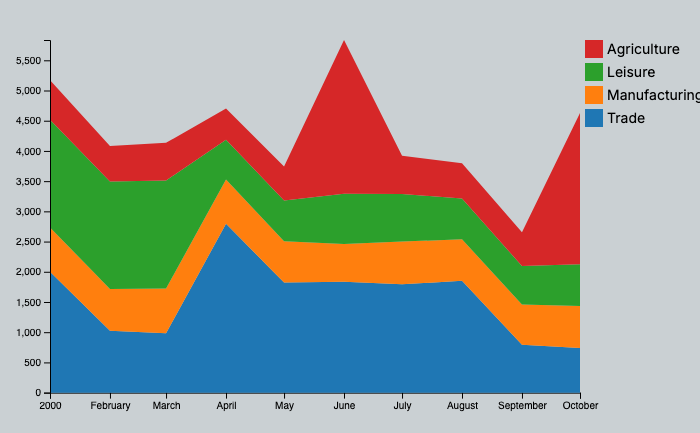
Stacked area chart
You show a total and how each component contributes over time.
stacked_area_chart()
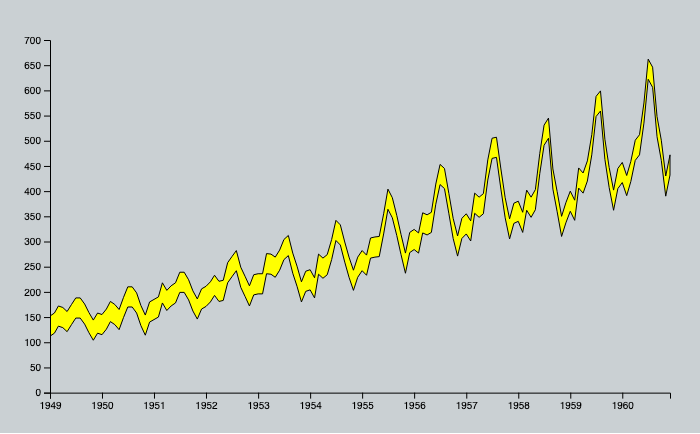
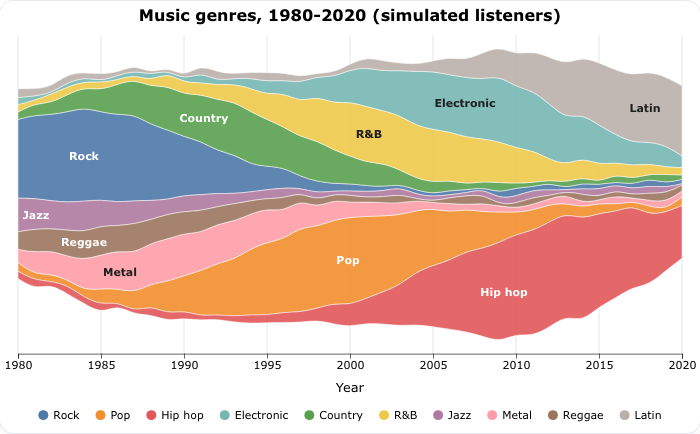
Streamgraph
Many categories change over time and the overall shape matters more than exact values.
streamgraph()
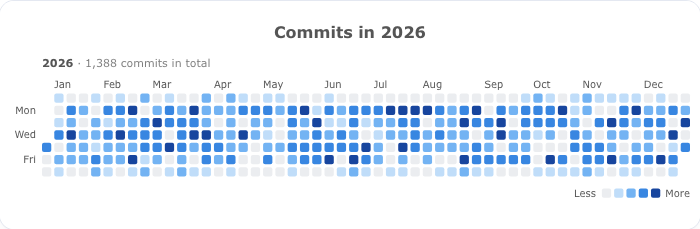
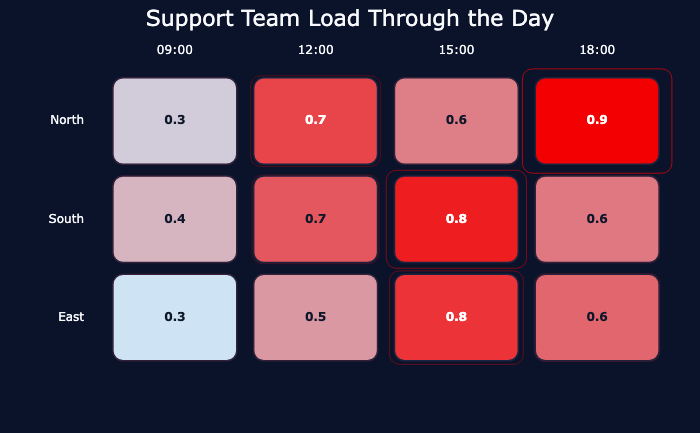
Calendar heatmap
You look for daily, weekly or seasonal patterns in a daily series.
calendar_heatmap()
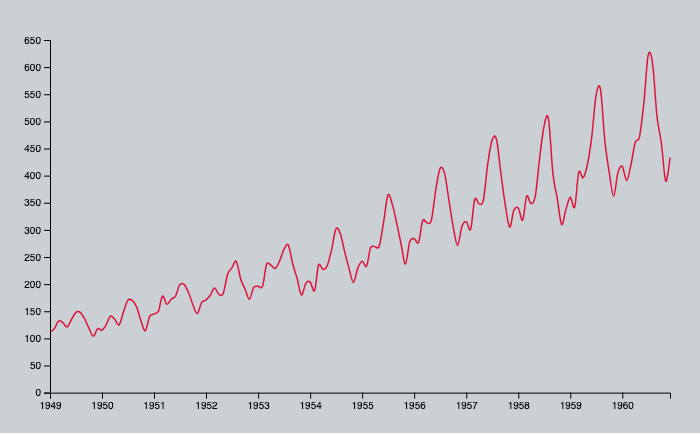
Animated line chart
You present a single series and want it to draw itself on click.
anim_line_chart()
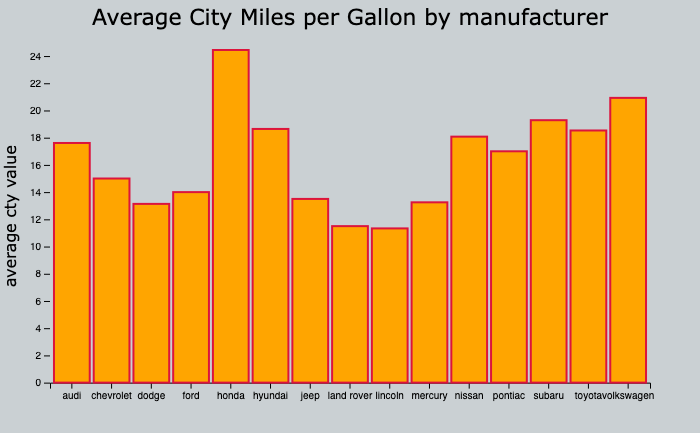
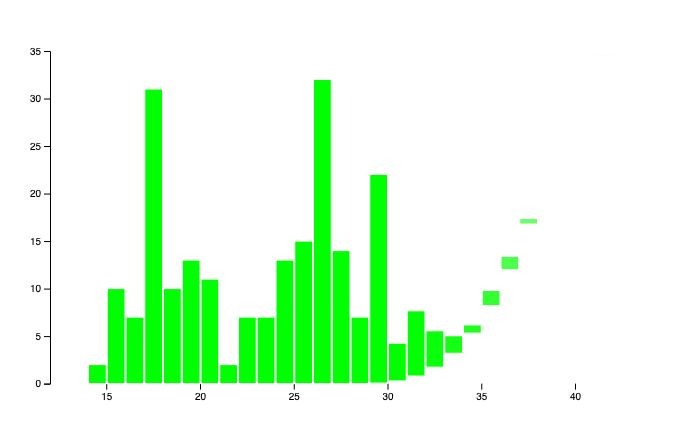
Animated histogram
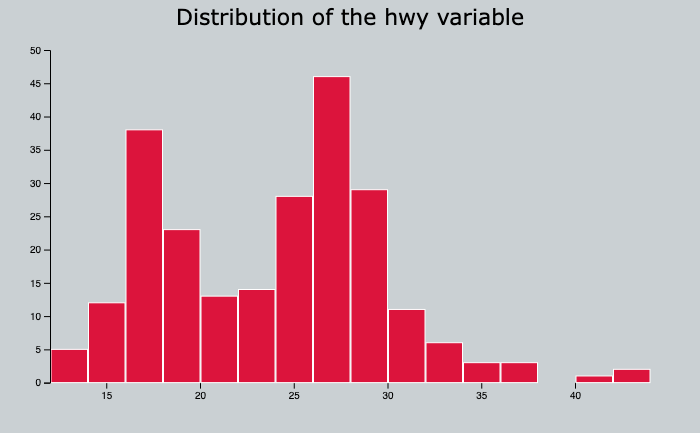
You present a distribution and want the bars to grow on click.
animated_histogram()


No chart matches your search.